
Companion analyses. This is the state-level companion to CASPR's 10-Year CMS Cost Impact of Negotiated First-Line Suzetrigine Access (the federal fiscal model) and to the core policy paper, Negotiating First-Line Access to Non-Addictive Painkillers for All Americans.
California's controllable opioid Rx pool
California dispensed approximately 11 million opioid prescriptions in 2023, about 9 percent of the national total of 125 million (CDC 2023 dispensing rate of 28.0 prescriptions per 100 persons applied to a state population of approximately 39 million). Within that 11 million, roughly 4.3 million sit inside payer or program structures that California can act on without federal approval. The remaining 7 million flow through Medicare Part D in California, which is federally administered.
California's directly controllable pool is ~4.3M opioid Rx per year, dominated by Medi-Cal Rx. CA Medicare Part D adds ~7M Rx but is federally administered.
| Channel | Annual Rx (2027 est.) | Direct CA control? | Notes |
|---|---|---|---|
| Medi-Cal Rx | 2,900,000 | Yes | DHCS administers a single statewide pharmacy benefit since January 2022 (single PBM, single PDL, single utilization-management framework). |
| Workers' compensation | 500,000 | Yes | Department of Industrial Relations sets the workers' compensation pharmacy fee schedule and the MTUS Drug List. |
| CalPERS | 450,000 | Yes | Direct purchaser for ~1.5M state employees, retirees, and dependents. Negotiates pharmacy terms via OptumRx and basic plans. |
| Covered California | 400,000 | Indirect | ~1.7M enrollees. State influences formulary structure via the Essential Health Benefit benchmark plan and Covered California qualified health plan rules. |
| UC Health (employees + dependents) | 55,000 | Yes | ~280K covered lives. UC system has direct purchasing authority through UC Health Care Facilities Authority. |
| CDCR | 40,000 | Yes | ~95K incarcerated population served by California Correctional Health Care Services. |
| California state-controllable subtotal | 4,345,000 | Yes | |
| CA Medicare Part D (for reference) | 7,000,000 | No (federal) | Included only under CMS national negotiation or a CMMI model that extends to all Part D plans. |
| California total opioid Rx | 11,345,000 |
All channel volumes are state-level estimates that triangulate published enrollment counts, the CDC 2023 California opioid dispensing rate of 28.0 per 100 persons, and proportional shares of the national CMS pool used in the federal model. Treat these as directional sizing, not a DHCS-grade actuarial baseline.
Modeled California fiscal impact
Applying the federal model's per-avoided-Rx Price2 net fiscal benefit (about $114 of net fiscal benefit per avoided opioid prescription, derived from $14.47B in net 10-year CMS impact across approximately 127 million cumulative avoided Rx in the federal Price2 case) to California's controllable channels gives the directional estimates below.
| Channel | 10-year cumulative avoided Rx | 10-year net fiscal impact | OUD prevented | Deaths avoided |
|---|---|---|---|---|
| Medi-Cal Rx | ~5.3M | -$0.60B | ~31.7K | ~1,200 |
| Workers' compensation | ~0.9M | -$0.10B | ~5.5K | ~210 |
| CalPERS | ~0.8M | -$0.09B | ~4.9K | ~190 |
| Covered California | ~0.7M | -$0.08B | ~4.4K | ~170 |
| UC Health | ~0.1M | -$0.01B | ~0.6K | ~25 |
| CDCR | ~0.07M | -$0.01B | ~0.4K | ~17 |
| CA state-controllable total (Price2) | ~7.9M | -$0.90B | ~47.6K | ~1,800 |
| + CA Medicare Part D (federal) | ~12.8M | -$1.45B | ~76.6K | ~2,970 |
| CA total (state + CA Medicare) | ~20.7M | -$2.36B | ~124K | ~4,800 |
Negative values in the fiscal-impact column represent money California (or CMS, in the CA Medicare Part D row) does not spend over the 10-year window relative to the StatusQuo trajectory. OUD prevented and deaths avoided columns count California beneficiaries. These are central estimates; the per-avoided-Rx driver alone implies roughly plus or minus 10 to 15 percent (about $0.8 to $1.0 billion on the state-controllable headline).
Basis for the California scaling. Same Price2 ($2/pill) scenario, same Bass adoption curve (p=0.03, q=0.50, peak=85%), same 0.6 percent acute OUD incidence per avoided Rx, same 1.4 percent OUD-attributable excess all-cause mortality, same $5,900 incremental annual CMS medical cost per OUD beneficiary. The only thing that changes is the size of the addressable Rx pool. California's state-controllable share is roughly 6 percent of the federal CMS pool, so its scaled fiscal impact is roughly 6 percent of the federal Price2 result.
Where the California savings accrue
The state-controllable line averages about $0.9 billion over 10 years, but it does not all sit in the General Fund. About 40 percent of the Medi-Cal Rx line is California state-share under the blended FMAP (regular FMAP at the 50 percent CA floor plus ACA-expansion at 90 percent federal, weighted by enrollee mix); the other 60 percent is a federal Medicaid pull-down that California captures simply by spending less on Medi-Cal opioid-related care. CalPERS, UC Health, CDCR, and the state-employer share of Workers Compensation hit the state appropriations side directly. Covered California is mostly federal subsidy plus member premium.
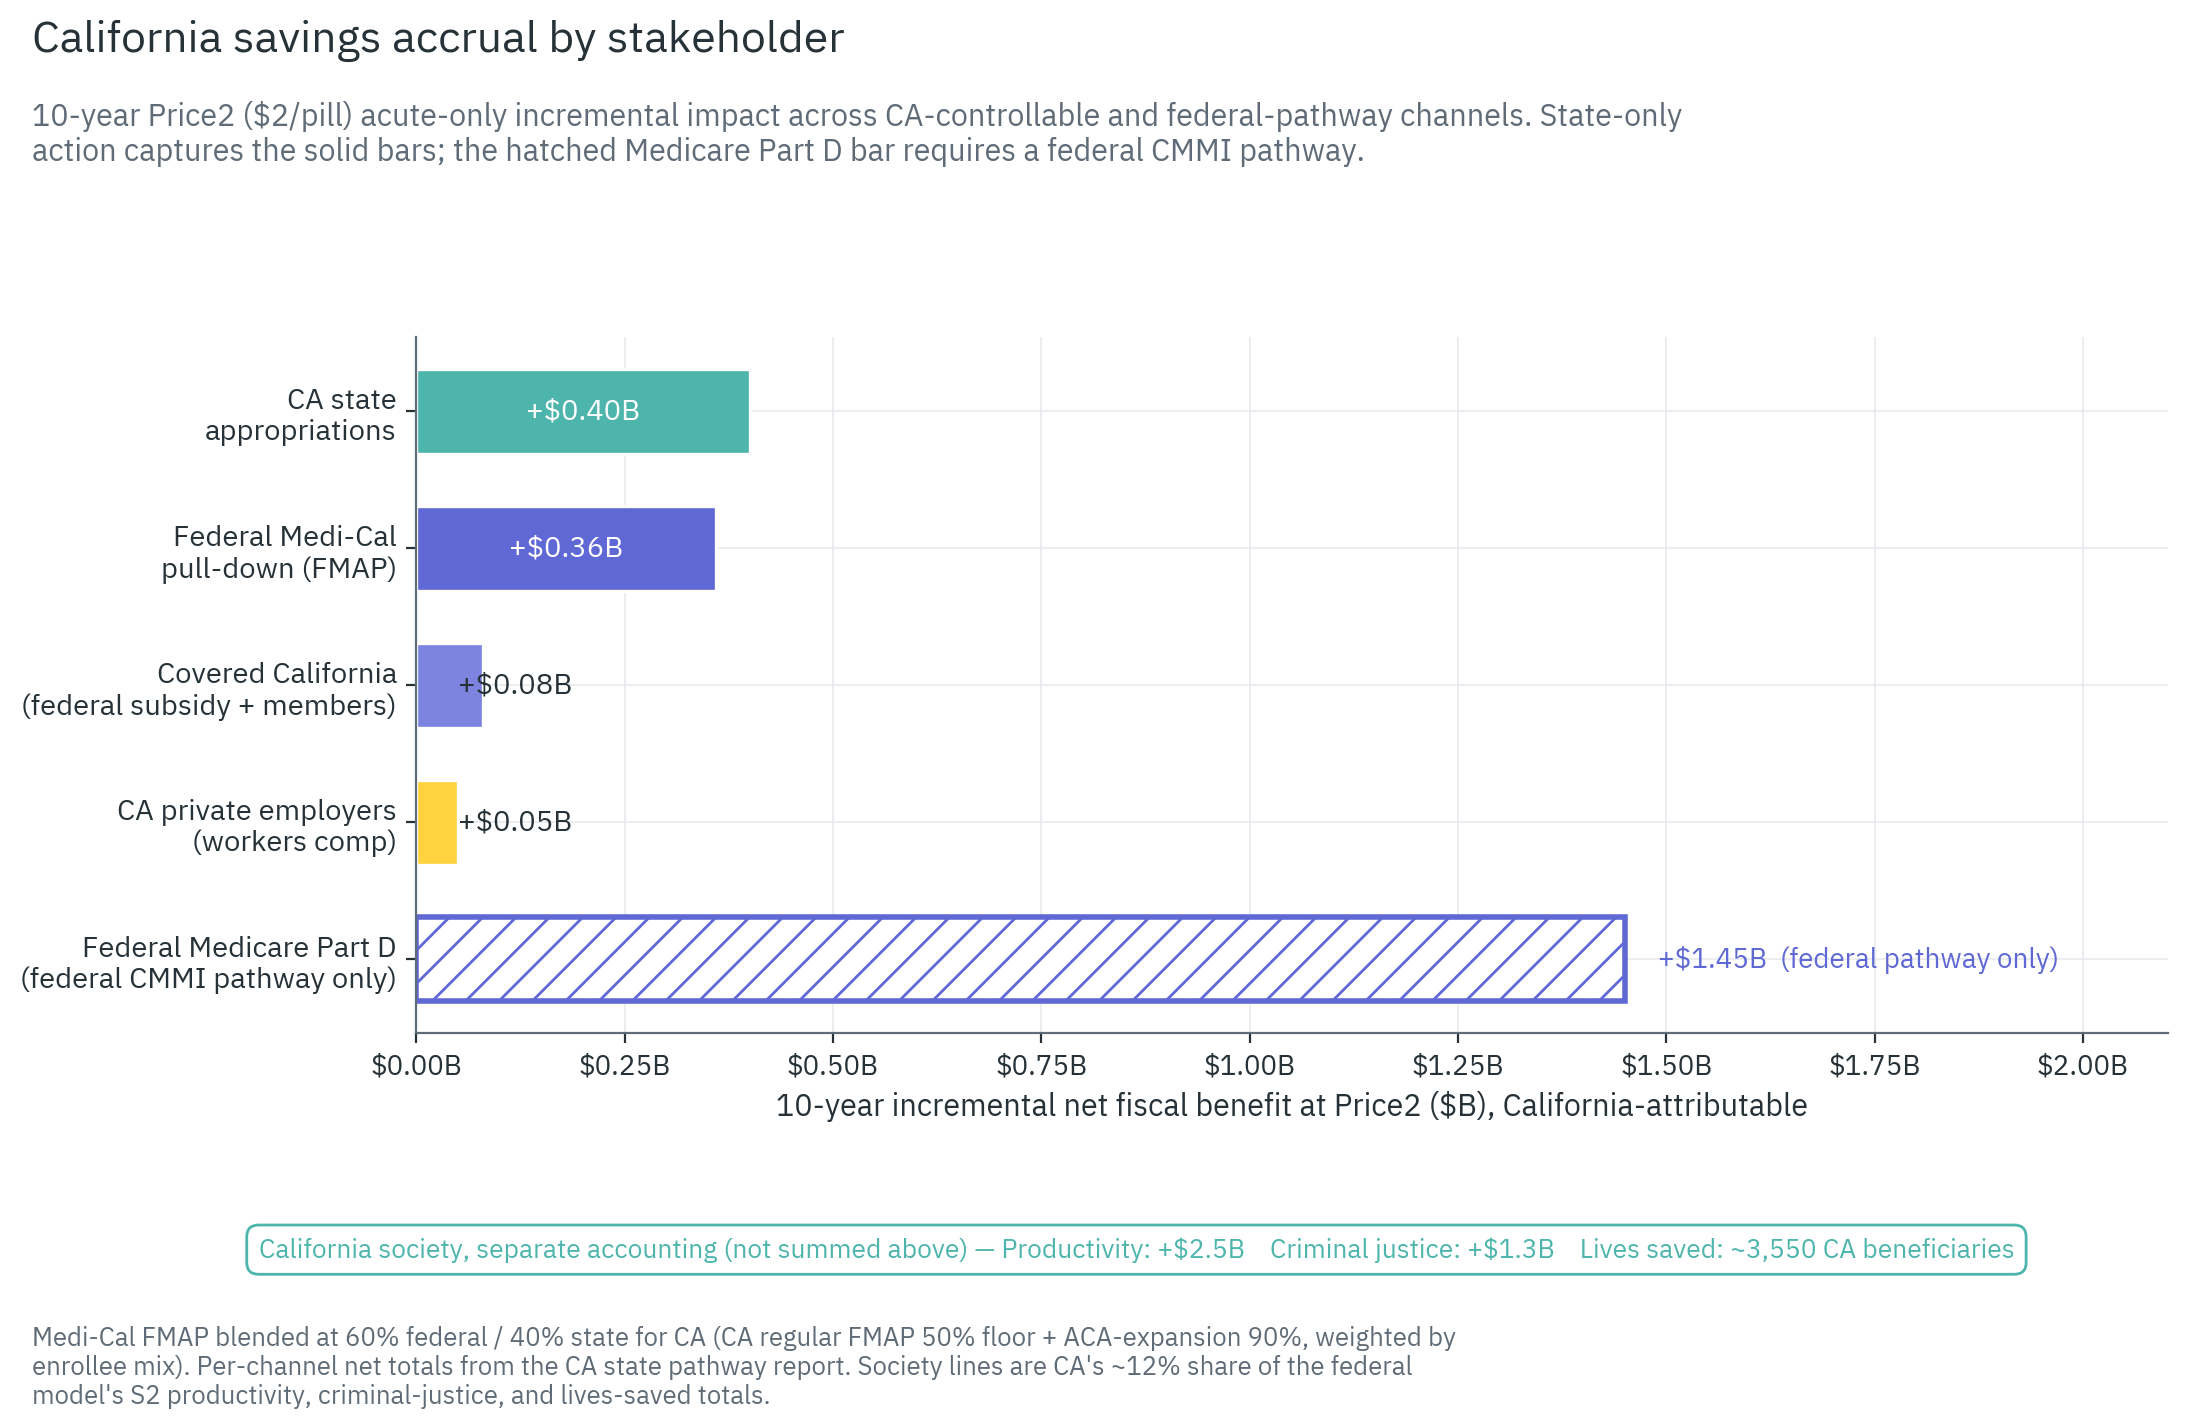
Figure: 10-year Price2 acute-only incremental net fiscal benefit, California-attributable, decomposed by stakeholder. Solid bars represent state-only-pathway captures; the hatched Medicare Part D bar requires a federal CMMI pathway and is shown for comparison.
Stakeholder breakdown (Price2 10-year, California-attributable).
- CA state appropriations: ~$0.40B. Medi-Cal state-share (40 percent of $0.60B = $0.24B) plus CalPERS, UC Health, CDCR, and the state-employer share of Workers Comp. This is the line that hits the General Fund and Medi-Cal directly.
- Federal Medi-Cal pull-down via FMAP: ~$0.36B. Federal Medicaid match (60 percent of $0.60B Medi-Cal Rx) drawn into California simply because Medi-Cal pharmacy + medical spending falls when opioid prescribing falls. Available under state-only action.
- Covered California: ~$0.08B. Federal advanced premium tax credits + member premium effects from lower-cost acute pain care.
- CA private employers (Workers Comp employer share): ~$0.05B. The half of the modeled $0.10B Workers Comp line that flows to private employers rather than the State Compensation Insurance Fund or self-insured state agencies.
- Federal Medicare Part D: ~$1.45B (federal CMMI pathway only). Larger than any state-controllable line. Not captured under unilateral CA action; requires a federal pathway running in parallel. Shown hatched in the figure to indicate this.
- California society (separate accounting): ~$1.5B productivity savings, ~$0.8B avoided criminal-justice cost, and roughly 1,800 OUD-attributable deaths avoided, matching the state-controllable prevention totals above. Not summed with the fiscal lines above.
FMAP allocation is directional (CA blended ~60 percent federal / 40 percent state for drug-related Medi-Cal spend). Per-state Medi-Cal Drug Rebate Program flows, supplemental rebates, and managed-care-organization risk corridors all bend this allocation in ways the figure does not capture. Society lines are scaled to California's state-controllable prevention totals above (about 48,000 OUD cases and 1,800 deaths), roughly 7 percent of the federal model's S2 acute-only productivity, criminal-justice, and lives-saved totals.
Two implications for the California strategy. First, even on a state-only pathway California captures roughly equal dollars in state appropriations and federal pull-down. The federal Medicaid match is meaningful even when California acts alone. Second, the federal Medicare Part D line ($1.45B) is larger than all six California-controllable channels combined ($0.90B) and more than twice the Medi-Cal Rx line on its own. That makes state action the fastest route to the evidence base for capturing the larger federal prize, not a reason to wait: acting now builds the real-world adoption and outcomes record a federal pathway needs, and serves as a backstop if that pathway stalls.
The numbers in California context
The $0.9 billion in net savings, 48,000 OUD cases prevented, and 1,800 deaths avoided are easier to weigh against the state fiscal and public-health benchmarks California already tracks.
Fiscal scale.
- $0.9 billion over 10 years averages to about $90 million per year in net state savings, roughly 0.6 percent of annual Medi-Cal pharmacy spend (~$15 billion per year per recent DHCS budget detail). Over the full 10 years, the $0.9 billion in savings nearly matches the ~$1 billion the Newsom administration committed to the 2023 Master Plan for Tackling Fentanyl.
- The modeled suzetrigine drug spend in the California pool is roughly $0.25 billion over 10 years (about $25 million per year, or 0.17 percent of annual Medi-Cal pharmacy spend), more than offset by avoided opioid drug spend and avoided OUD treatment. No new General Fund appropriation is required: California pays for suzetrigine through the existing Medi-Cal pharmacy benefit and saves more than it spends.
Public-health scale.
- 1,800 OUD-attributable deaths avoided over 10 years equals about 180 per year averaged across the modeled California beneficiary pool. California recorded approximately 7,300 opioid-involved overdose deaths in 2023 (CDPH), so the modeled prevention represents roughly 2.5 percent of the current annual death toll. The marginal share rises in later years of the model as the prevented-OUD pool builds.
- 48,000 OUD cases prevented equals about 4,800 new California OUD diagnoses avoided per year. California's prevalent OUD population is currently estimated at roughly 800,000 to 1 million people (SAMHSA NSDUH state estimates). The 48,000 represents incremental prevention on the new-case side, not treatment of existing OUD.
- Each prevented OUD case avoids a treatment burden the model costs over about 5 years, with downstream morbidity continuing well beyond that. Each prevented death, by contrast, falls overwhelmingly on working-age adults, so it corresponds to roughly 35 to 45 years of life saved.
The Medi-Cal share dominates because Medi-Cal is by far the largest California channel the state controls (about 67 percent of the controllable pool). CalPERS, Workers' Compensation, Covered California, UC Health, and CDCR add meaningful volume but are individually small. The state's leverage is therefore concentrated in DHCS Medi-Cal Rx pharmacy benefit policy.
Important fiscal-attribution caveat for commercial-style channels. CalPERS, UC Health, and Covered California pay commercial-rate opioid drug costs and would directly capture the avoided opioid drug spend portion of the savings. The downstream OUD medical-cost savings, however, often flow to Medi-Cal in practice because beneficiaries with established OUD frequently lose commercial coverage and become Medicaid-eligible. The numbers above attribute the full per-Rx benefit to each channel for arithmetic simplicity. A more granular state fiscal accounting would shift roughly 60 to 75 percent of the OUD-medical share of CalPERS, UC, and Covered CA savings into the Medi-Cal column.
Patient impact in human terms
The same Price2 scenario that produces the fiscal savings also prevents OUD cases and deaths among Californians. The counts below describe those outcomes at the patient and family level.
What 48,000 prevented OUD cases mean for California families
- Over the 10-year window this averages to about 4,800 fewer Californians per year developing OUD as a result of substituting suzetrigine for opioid prescriptions in acute-pain settings.
- Typical OUD treatment duration in the Medi-Cal population is roughly 5 years on average (some patients cycle through coverage repeatedly across longer windows). Each prevented case avoids that treatment burden and the downstream productivity, family, and criminal-justice costs that the federal companion analysis documents in a separate societal callout.
- Each prevented OUD case typically affects 2 to 3 close family members in addition to the patient. The 48,000 prevented cases over 10 years therefore correspond to disrupted-family-trajectory avoidance for an estimated 120,000 to 180,000 Californians (patients plus close family) over the same window.
- The 1,800 OUD-attributable deaths avoided over 10 years average roughly 180 per year. OUD-attributable mortality predominantly affects working-age adults, so each prevented death corresponds to roughly 35 to 45 years of life lost averted under standard public-health life-table accounting.
California state-controllable opioid prescribing has fallen by roughly 40 percent since 2014. Without first-line suzetrigine access the modeled decline continues at roughly 2 percent per year. With first-line access, the decline accelerates to bring the 2036 California state-controllable opioid Rx pool to about 2.2 million, roughly 1.4 million fewer prescriptions per year than the status-quo path.
The crisis is worsening (left panel). First-line access would prevent a small but real share of it in state-controllable channels (right panel) while building the evidence base for federal scaling.
State levers California already has
California holds an unusually deep set of pharmacy-benefit levers compared with most other states. The relevant ones for suzetrigine access are:
- Medi-Cal Rx (DHCS unified pharmacy benefit, effective January 1, 2022). All Medi-Cal pharmacy claims now flow through a single state PBM with a single statewide PDL, single prior authorization framework, and single supplemental rebate authority. The Medi-Cal Pharmacy and Therapeutics Committee can move suzetrigine to preferred status at a quarterly meeting; the Department of Health Care Services can negotiate a state-only supplemental rebate beyond federal Medicaid Best Price; and DHCS can remove prior authorization and step-therapy requirements administratively.
- Medi-Cal supplemental rebate authority (42 USC 1396r-8(d)(1)(A)). California has one of the most active supplemental rebate programs in the country and routinely negotiates state-level rebates beyond federal best price.
- CalPERS direct purchasing. CalPERS contracts directly with OptumRx for its self-funded basic plans and can negotiate plan-specific drug pricing and formulary placement.
- Workers' compensation pharmacy fee schedule. The DIR sets the maximum reimbursement under the MTUS Drug List. The state can place suzetrigine on the preferred portion of the list and adjust the fee schedule to reflect a negotiated price.
- Covered California EHB benchmark plan. Covered California can press qualified health plan formularies to place suzetrigine on a non-restrictive tier as a condition of certification. This is an influence lever, not direct control: it shapes carrier formularies through certification standards rather than setting one formulary the way Medi-Cal Rx does.
- SB 17 drug price transparency (2017) and AB 824 pay-for-delay (2019). Existing California drug-pricing infrastructure can be used to publish suzetrigine pricing data and require advance notice of changes.
- OSHPD/HCAI cost reporting. California can require hospitals and ambulatory surgery centers to report opioid prescribing rates as a quality metric, creating a documented baseline against which suzetrigine-driven reductions can be measured.
Equity impact
Prior authorization, step therapy, and higher cost sharing suppress uptake most among lower-income and rural patients. Removing them through Medi-Cal delivers the fiscal benefit and an equity benefit together. About two-thirds of the modeled California-controllable benefit accrues to Medi-Cal beneficiaries, who skew lower-income, rural, and disproportionately Black, Latino, and AI/AN. Of the six channels in this report, Medi-Cal is where removing the access barrier yields the most for equity.
Who decides what, and when
Each lever runs through an existing California decision-maker and an existing decision cadence. None of the levers below requires new legislation under current California pharmacy-benefit authority.
| Decision | Who decides | Where it happens | Earliest realistic timing |
|---|---|---|---|
| Medi-Cal Rx PDL preferred-status change for suzetrigine | DHCS Director, on recommendation of the Medi-Cal Pharmacy and Therapeutics Committee | Quarterly Medi-Cal P&T meeting (publicly noticed) | Q3 2026 |
| State supplemental rebate negotiation with Vertex | DHCS Pharmacy Benefits Division; sign-off by DHCS Director | Bilateral negotiation; no public meeting required | Q3 2026 to Q1 2027 |
| CalPERS plan-year formulary change | CalPERS Pharmacy and Therapeutics Committee; adopted by CalPERS Board of Administration | CalPERS public Board meeting | Q4 2026 for plan year 2027 |
| MTUS Drug List update for workers' compensation | DIR Administrative Director, on recommendation of the MTUS update process | DIR public rulemaking | 2027 |
| Covered California EHB benchmark guidance to QHP carriers | Covered California Executive Director, on direction from the Covered California Board | Covered California Board meeting | Q4 2026 for plan year 2027 |
| UC Health formulary placement | UC Pharmacy Benefits Committee | Internal UC governance | 2027 plan year |
| CCHCS formulary placement | Federal Receiver, in coordination with CCHCS Director | Internal CCHCS governance | 2026 |
| Statewide reporting and adoption monitoring | DHCS, in coordination with CDPH | DHCS administrative action | Concurrent with rollout |
California-specific risks and mitigations
- Patient access friction from formulary churn during the rollout. Real but manageable. The change affects only opioid-naive patients receiving new acute-pain prescriptions; patients on existing opioid regimens are unaffected. Medi-Cal Rx already handles roughly 100 million pharmacy claims per year and routinely shifts coverage status of branded drugs. The Medi-Cal P&T Committee can stage the transition with prescriber and patient communication and a defined transition period that grandfathers in-progress treatment plans.
- Medi-Cal P&T process contestation by stakeholders. Possible. PBM, plan, and pharmaceutical industry stakeholders sometimes contest preferred-status changes through public comment, litigation, or legislative pressure. The unified Medi-Cal Rx benefit removes most plan-level resistance, since all Medi-Cal pharmacy claims now flow through a single state-controlled PDL rather than 25-plus managed-care formularies. Mitigation: stage the change with a clear evidence base from the federal model, engage stakeholders early, and post the supporting cost-effectiveness analysis with the proposed PDL change.
- Commercial-channel pricing pressure on Vertex from California disclosure. Real concern, and the load-bearing answer to why Vertex would agree. Two distinct protections apply. State Medicaid supplemental rebates are excluded from the federal Best Price calculation by statute (42 USC 1396r-8), so a deep Medi-Cal net price does not reset Vertex's reported Best Price. And because a state supplemental rebate is paid as a separate manufacturer-to-state payment that does not change reported AMP, ASP, or WAC, it generally sits outside the most-favored-nation clauses in commercial contracts, which key off those public benchmarks. State-specific deals structured this way have precedent in the Louisiana and Washington hepatitis C subscription agreements. The exact carve-out should be confirmed in the rebate agreement rather than assumed.
- Dual-eligible attribution. Roughly 1.5 million Californians are dually eligible for Medicare and Medi-Cal; their drug costs are paid by Medicare Part D, not Medi-Cal. The model excludes dual-eligible Rx from the Medi-Cal channel to avoid double-counting. CA Medicare Part D Rx is shown separately and is federally administered.
- Workers' compensation pharmacy spend is shrinking. California has aggressively reduced opioid prescribing in workers' compensation since the mid-2010s. The 500,000 Rx baseline used here may be optimistic if the trend continues steeper than modeled; it may be conservative if suzetrigine adoption accelerates the substitution.
- Implementation cost. The model does not include the cost of state implementation (P&T process, prescriber education, EHR changes, reporting infrastructure). These are real but small relative to the modeled fiscal impact and are typically absorbed in existing DHCS, DIR, CalPERS, and Covered California operating budgets.
Frequently asked questions
The objections and questions California stakeholders are likely to raise, with the responses available from the existing federal model and California-specific evidence base.
Is suzetrigine too new to commit to as first-line therapy?
Suzetrigine received FDA approval in January 2025 for moderate-to-severe acute pain. As of Vertex's February 2026 earnings release, more than 550,000 prescriptions had been filled in 2025, and the real-world safety profile has tracked the trial data. The proposal is preferred-status access, not mandated prescribing. Clinicians retain full discretion to prescribe opioids when clinically appropriate. The change shifts the default option in routine acute-pain workflows, which is where the modeled OUD prevention comes from.
Can California afford another drug program right now?
The model is net negative: about $0.9 billion in 10-year net savings, with roughly $0.25 billion in suzetrigine drug spend against $1.15 billion in offsetting savings, and no new General Fund appropriation. The Fiscal scale section above details the mechanics.
Will federal action fix this anyway, so California should wait?
The federal CMS Innovation Center pathway is at least 18 to 36 months from concept to first-day implementation, and ordinary IRA negotiation is unavailable for suzetrigine until 2034 at the earliest because of the 9-year small-molecule eligibility window. California can act in 6 to 12 months. Each year of delay reduces the cumulative addressable opioid Rx pool by 2 to 3 percent as overall opioid prescribing continues to decline, so a California deal starting in 2030 instead of 2027 captures roughly 25 percent fewer cumulative avoided Rx and roughly 25 percent less benefit. Waiting is a real choice with a real cost.
What about chronic-pain patients on long-term opioids?
Suzetrigine is approved for moderate-to-severe acute pain only; Vertex is currently running two Phase 3 trials in painful diabetic peripheral neuropathy and has not yet sought a chronic-pain label. The proposal does not displace existing chronic-pain regimens. It changes the first-line option for acute pain in opioid-naive patients, which is the population where the modeled OUD-prevention benefit comes from.
How does this fit with California's existing opioid response?
The proposal is the upstream prevention complement to existing California efforts. The Master Plan for Tackling Fentanyl (2023) invested approximately $1 billion in interdiction, treatment capacity, and overdose-reversal infrastructure; first-line suzetrigine access is the upstream policy lever focused on stopping new OUD from acute-pain prescribing rather than treating existing OUD. CalRx showed California's willingness to use direct purchasing power to lower drug costs, though its own product launches have run slower than promised, a reminder that the binding constraint here is execution, not authority. CARE Court and the Master Plan addressed the downstream side. This proposal addresses the upstream side using the same pharmacy-benefit lever family.
Limitations
- California opioid Rx volumes by channel are state-level estimates, not directly observed audited figures. The Medi-Cal channel anchors to a CA share of US Medicaid opioid Rx (roughly 16 percent of national Medicaid opioid prescriptions per Bashir 2022 SDUD analysis projected to 2027); other channels are estimated from enrollment counts and the CDC California per-capita dispensing rate. Treat as directional sizing.
- The fiscal impact uses the per-avoided-Rx average from the federal Price2 case ($114 per avoided Rx). California-specific cost structures (slightly higher CA medical care costs, Medi-Cal-specific rebate structures, state-specific OUD prevalence) would shift this number by roughly plus or minus 10 to 15 percent in a more granular state model.
- The downstream OUD medical cost benefit is attributed to each channel for simplicity, but in practice a substantial share of OUD-related medical care for CalPERS, UC Health, and Covered California enrollees eventually accrues to Medi-Cal due to coverage churn. Total California fiscal benefit is approximately accurate; the per-channel split is approximate.
- This analysis assumes DHCS and CalPERS administrative action without legislative complications. Faster timelines are plausible if political alignment is strong; slower timelines are plausible if the Medi-Cal P&T process is contested by stakeholders.
- The federal-vs-state policy sequencing question, multi-state coalition design, and federal CMMI model timing are out of scope for this report and are treated separately in the Federal, State-Led, and Hybrid Policy Pathways companion analysis.
Methodology
This analysis is a state-level extension of the federal CMS 10-year fiscal impact model documented in the companion report. All clinical assumptions (acute OUD incidence per avoided Rx, OUD-attributable mortality, incremental annual CMS medical cost per OUD beneficiary, suzetrigine pills per course, Bass adoption curve parameters) are held constant from the federal model.
California-specific channel sizing
- Medi-Cal Rx 2027 baseline: anchored to the 2023 CMS Medicaid opioid claims dataset (national approximately 20.0 million claims), apportioned to California using the CA share of US Medicaid opioid Rx (approximately 16 percent per Bashir et al. AHDB 2022, scaled for post-redetermination Medi-Cal enrollment of approximately 14.5 million).
- CalPERS, UC Health, and Covered California Rx counts: derived by applying the 2023 CDC California per-capita opioid dispensing rate (28.0 prescriptions per 100 persons) to published enrollment counts, adjusted for population age and risk skew per channel.
- Workers' compensation: derived from California Department of Industrial Relations historical opioid prescribing data trends and California Workers' Compensation Insurance Rating Bureau pharmacy benefit reports.
- CDCR: derived from CCHCS pharmacy benefit reporting and population census.
- CA Medicare Part D: derived by applying the CA share of US Medicare Part D enrollment (approximately 12 percent of national Part D enrollment) to the federal model 2027 Medicare opioid Rx baseline.
Per-Rx fiscal benefit derivation
From the federal Price2 result: net 10-year CMS fiscal impact $14.47 billion, divided by approximately 127 million cumulative avoided opioid Rx over the 10-year window (the S2 cumulative-avoided-Rx total carried in the federal companion model), yields a per-avoided-Rx average net benefit of $114. This is applied to each California channel's cumulative avoided Rx to estimate channel-level fiscal impact. The 127 million figure reflects the federal model's 50.4 percent acute addressable share and the cumulative Bass-curve penetration over the 10-year window (85 percent terminal peak), applied to the federal 2027-baseline Rx pool.
What this report does not do
- It does not run a separate California Bass-diffusion adoption model. The same federal Bass parameters (p=0.03, q=0.50, peak=85%) are assumed to hold under California negotiated-access scenarios. A more granular state model could differentiate California-specific prescriber-adoption dynamics.
- It does not separately model commercial-payer coverage spillover effects. The companion federal report includes a brief discussion of commercial spillover; that discussion applies in California as well.
- It does not model the cost of state implementation (P&T process, prescriber education, IT changes); the Risks section notes these are small relative to the modeled benefit.
- It does not propose specific legislative or regulatory text; the recommended actions use existing administrative authority.
Appendix: First 90 days of California action
A concrete sequence tied to existing California processes. The dates below are illustrative and assume a Q3 2026 administrative kickoff. Each step uses existing DHCS, CalPERS, DIR, Covered California, UC, or CCHCS authority.
DHCS internal kickoff and P&T agenda placement.
DHCS Director directs the pharmacy benefits team to add suzetrigine evaluation to the next quarterly Medi-Cal Pharmacy and Therapeutics Committee meeting agenda. The pharmacy benefits team prepares an initial briefing memo summarizing FDA approval status, real-world adoption data through 2025 from Vertex disclosures, the federal CASPR fiscal model, and the California-specific channel sizing in this report.
Owner: DHCS Director and DHCS Pharmacy Benefits Division. Output: P&T agenda placement; internal briefing memo.
Open supplemental rebate negotiation; prepare cost-effectiveness analysis.
DHCS opens a state supplemental rebate negotiation with Vertex targeting net pricing in the $1.50 to $3.00 per pill range (the Price1 to Price3 band in the federal model). The DHCS pharmacy benefits team prepares the formal cost-effectiveness analysis required for the P&T submission, including modeled fiscal impact, OUD prevention, and equity implications. CalPERS Pharmacy Benefits team receives parallel briefing for plan-year-2027 evaluation.
Owner: DHCS Pharmacy Benefits Division; CalPERS Pharmacy Benefits team. Output: Term sheet under negotiation; cost-effectiveness analysis ready for P&T review.
Public Medi-Cal P&T meeting; CalPERS, DIR, and Covered CA briefings.
The Medi-Cal P&T Committee meets in public session with suzetrigine on the agenda. The Committee evaluates clinical evidence, cost-effectiveness, equity impact, and the proposed PDL placement. Public comment period runs concurrently. CalPERS Pharmacy and Therapeutics Committee receives the same briefing for plan-year-2027 consideration. DIR and Covered California staff are briefed on parallel actions in their respective channels.
Owner: Medi-Cal P&T Committee; CalPERS P&T Committee; DIR; Covered California staff. Output: Recommended PDL placement; CalPERS plan-year-2027 staff recommendation; DIR and Covered CA aligned timelines.
PDL update issued; prior authorization and step therapy removed administratively.
If P&T moves suzetrigine to preferred status, DHCS issues a PDL update through the standard monthly PDL update cycle. Prior authorization and step therapy requirements are removed administratively. The CalPERS Board adopts the plan-year-2027 formulary change at its public Board meeting. DIR opens MTUS Drug List rulemaking for suzetrigine inclusion.
Owner: DHCS Director; CalPERS Board of Administration; DIR Administrative Director. Output: Medi-Cal Rx PDL change effective; CalPERS 2027 formulary set; DIR rulemaking initiated.
Remaining channels follow; reporting infrastructure stands up.
Covered California issues benchmark guidance for QHP carriers' 2027 formularies. UC Health Pharmacy Benefits Committee adopts a parallel formulary placement. CCHCS adopts the placement through internal CCHCS governance. DHCS and CDPH stand up the statewide reporting framework to track suzetrigine adoption rates, opioid-Rx substitution rates, and OUD-prevention signals across the California beneficiary population.
Owner: Covered California Executive Director; UC Pharmacy Benefits Committee; CCHCS Director; DHCS and CDPH joint reporting team. Output: All six California channels aligned; baseline measurement infrastructure live; first quarterly adoption report ready for early 2027.
Why this sequence matters. The Medi-Cal Rx unified pharmacy benefit (effective January 2022) consolidated what used to be 25-plus managed care plan formularies into one statewide PDL. That single piece of administrative infrastructure makes a state-level access change practical in a way it was not before 2022. The 90-day sequence above uses that infrastructure as the lead lever; the other five channels follow rather than gating action.
Companion analyses: the 10-Year CMS Cost Impact of Negotiated First-Line Suzetrigine Access (the underlying federal model), and the Federal, State-Led, and Hybrid Policy Pathways analysis (the federal-vs-state sequencing discussion). Source data, model code, and per-channel calculations available with the broader analysis pipeline. Reach out via caspr.org for the full underlying assumptions.